Chapter Outline
Chapter 6: Analytics
Collecting feedback is only the first step. To make it actionable, you need analytics:
- How many readers voted “helpful” vs. “not helpful”?
- Which posts get the most engagement?
- How are comments trending over time?
In this chapter, we’ll:
- Learn the importance of analytics in feedback systems.
- Build analytics endpoints in FastAPI and NestJS.
- Grow with a simple React dashboard using Chart.js.
6.1 Why Analytics?
Analytics transforms raw feedback into insights:
- Quantitative: % of readers who found content useful.
- Comparative: Which posts perform better?
- Temporal: Are votes/comments increasing or declining over time?
Without analytics, feedback stays as isolated records. With analytics, you get signals you can act on (improving posts, planning new topics, identifying pain points).
6.2 Analytics API Endpoints
FastAPI — Aggregated Stats
app/analytics.py1from fastapi import APIRouter, Depends2from sqlalchemy.orm import Session3from sqlalchemy import func4from app.main import get_db5from app.models import Feedback67router = APIRouter()89@router.get("/analytics/summary")10def analytics_summary(db: Session = Depends(get_db)):11 total = db.query(func.count(Feedback.id)).scalar()12 helpful = db.query(func.count(Feedback.id)).filter(Feedback.helpful == True).scalar()13 not_helpful = db.query(func.count(Feedback.id)).filter(Feedback.helpful == False).scalar()14 return {15 "total": total,16 "helpful": helpful,17 "not_helpful": not_helpful,18 "helpful_rate": (helpful / total * 100) if total else 019 }2021@router.get("/analytics/by_post")22def analytics_by_post(db: Session = Depends(get_db)):23 results = (24 db.query(Feedback.post_slug, func.count(Feedback.id).label("count"))25 .group_by(Feedback.post_slug)26 .all()27 )28 return [{"post_slug": slug, "count": count} for slug, count in results]
Register in app/main.py:
pythonfrom app import analytics# ...app.include_router(analytics.router)
NestJS — Aggregated Stats
src/feedback/feedback.analytics.controller.ts1import { Controller, Get } from '@nestjs/common';2import { InjectRepository } from '@nestjs/typeorm';3import { Repository } from 'typeorm';4import { Feedback } from './feedback.entity';56@Controller('analytics')7export class FeedbackAnalyticsController {8 constructor(9 @InjectRepository(Feedback)10 private repo: Repository<Feedback>,11 ) {}1213 @Get('summary')14 async getSummary() {15 const total = await this.repo.count();16 const helpful = await this.repo.count({ where: { helpful: true } });17 const notHelpful = await this.repo.count({ where: { helpful: false } });18 return {19 total,20 helpful,21 notHelpful,22 helpfulRate: total ? (helpful / total) * 100 : 0,23 };24 }2526 @Get('by_post')27 async getByPost() {28 const rows = await this.repo29 .createQueryBuilder('f')30 .select('f.postSlug', 'postSlug')31 .addSelect('COUNT(f.id)', 'count')32 .groupBy('f.postSlug')33 .getRawMany();34 return rows;35 }36}
Register in FeedbackModule:
tsimport { FeedbackAnalyticsController } from './feedback.analytics.controller';@Module({controllers: [FeedbackController, FeedbackAnalyticsController],// ...})export class FeedbackModule {}
6.3 React Analytics Dashboard
We’ll consume the /analytics API endpoints and display charts.
We are going to setup a new analytics dashboard application. We're going to setup a new React application using Vite. Follow the instuctions on the site to create a React + TypeScript application with the name feedback-ui.
Once the application is created, add the following component:
src/components/AnalyticsDashboard.tsx1import React, { useEffect, useState } from 'react';2import { Bar, Pie } from 'react-chartjs-2';3import {4 Chart as ChartJS,5 Title,6 Tooltip,7 Legend,8 ArcElement,9 BarElement,10 CategoryScale,11 LinearScale,12} from 'chart.js';1314ChartJS.register(Title, Tooltip, Legend, ArcElement, BarElement, CategoryScale, LinearScale);1516export const AnalyticsDashboard: React.FC<{ apiUrl: string }> = ({ apiUrl }) => {17 const [summary, setSummary] = useState<any>(null);18 const [byPost, setByPost] = useState<any[]>([]);1920 useEffect(() => {21 fetch(`${apiUrl}/analytics/summary`).then(res => res.json()).then(setSummary);22 fetch(`${apiUrl}/analytics/by_post`).then(res => res.json()).then(setByPost);23 }, [apiUrl]);2425 if (!summary) return <p>Loading analytics...</p>;2627 return (28 <div>29 <h2>Feedback Analytics</h2>3031 <h3>Overall Helpful Rate</h3>32 <Pie33 data={{34 labels: ['Helpful', 'Not Helpful'],35 datasets: [36 {37 data: [summary.helpful, summary.not_helpful],38 backgroundColor: ['#36A2EB', '#FF6384'],39 },40 ],41 }}42 />4344 <h3>Feedback Count by Post</h3>45 <Bar46 data={{47 labels: byPost.map(r => r.post_slug || r.postSlug),48 datasets: [49 {50 label: 'Feedback Count',51 data: byPost.map(r => r.count),52 backgroundColor: '#4BC0C0',53 },54 ],55 }}56 />57 </div>58 );59};
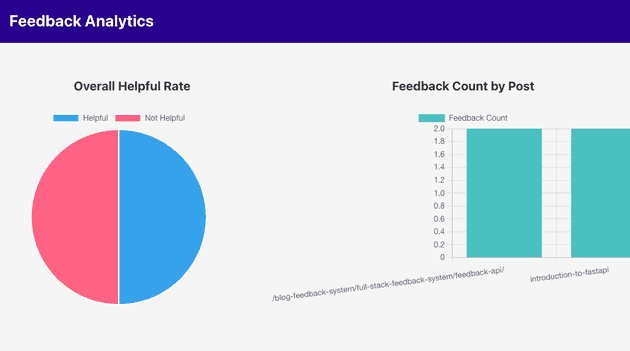
This component loads data from /analytics/summary, and /analytics/by_post routes, and saves them in the summary and byPost states respectively. The values within the states are then displayed as a pie chart and a bar chart.
To use the analytics dashboard component, go to you App.tsx module, and update the application component with the following:
tsx/** Components */import { AnalyticsDashboard } from './components/AnalyticsDashboard';// ...function App() {return <AnalyticsDashboard apiUrl="http://127.0.0.1:8000" />}
This will render the data pulled in from the backend API.
The following is a demonstration of the analytics dashboard. Note: additional styles have been added to the components to make it more useful.

6.4 Case Study Example
Imagine you’ve published 10 blog posts:
- Analytics shows 80% helpful rate on Python tutorials.
- Analytics shows 40% helpful rate on an older article.
Now you know where to focus edits, SEO improvements, or additional clarifications.
6.5 Summary
In this chapter, you:
- Added analytics endpoints in both FastAPI and NestJS.
- Built a React dashboard using
Chart.js. - Learned how analytics can turn raw feedback into actionable insights.
6.6 Exercise
- Extend your backend API with
/analytics/summaryand/analytics/by_post. - Build the AnalyticsDashboard component in
Gatsby. - Submit test feedback and confirm charts update correctly.
- (Optional) Deploy the dashboard as a protected admin route.
6.7 Next Step
In the next chapter, we’ll add notifications and prepare for sentiment analysis:
- Push alerts to Slack or email when new feedback arrives.
- (Later) run ML on comments to auto-tag them (positive/negative/neutral).